INTViewer?
With INTViewer,? powerful is easier to use and more portable than ever.
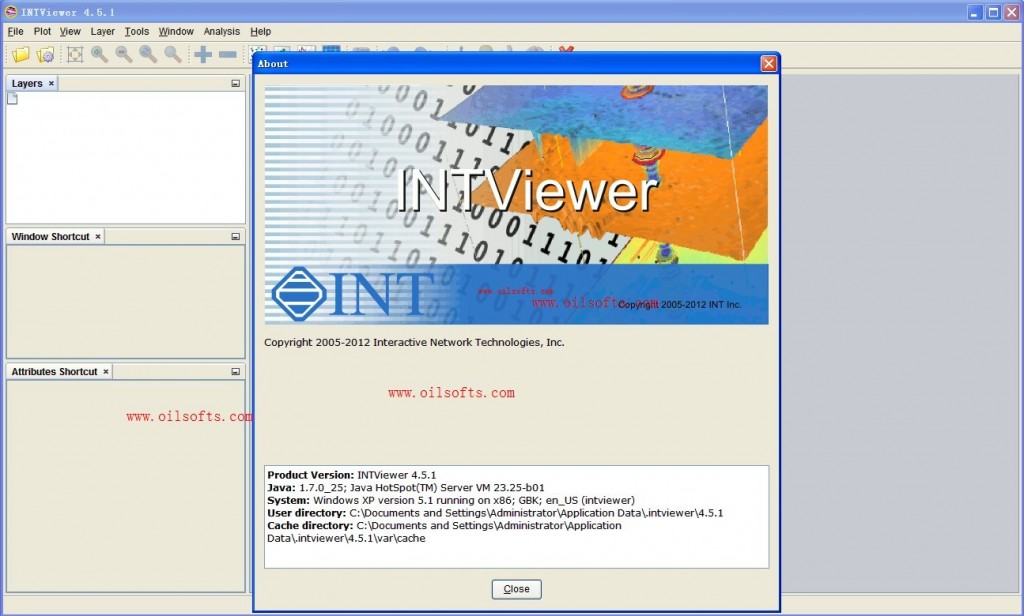
INTViewer is an innovative visualization platform for seismic analysis and QC. A modern interface presents the most useful features in an intuitive and logical manner. And you can take it with you: INTViewer runs on virtually any Windows, Mac, or Linux system whether it’s a laptop in the field or a workstation at the office. Sophisticated, powerful, and affordable, INTViewer is a compromise-free solution.
INTViewer highlights:
- Displays multiple data sets and file types on the same screen for quick comparisons
- Synchronized displays and cursor tracking for quick navigation through complex data.
- Map window is GIS aware and supports heterogeneous data with on-the-fly transformation.
- Extensible plug-in framework for adding custom utilities, data formats, and proprietary R&D
Simple-to-Use Interface with Sophisticated Controls
Synchronization of panning, zooming, or display parameters between windows aids rapid identification of trends and attribute relationships. You can effortlessly drag-and-drop data and events between 2D, 3D and map views. INTViewer also provides a rich array of interactive crossplots, histograms, power spectrum, FK display and signal-to-noise analyses.
Visualize 2D, 3D, pre-Stack and Time-Lapse Data
Rapidly navigate 2D lines, 3D volumes, gathers and attributes to discuss what-if scenarios. Synchronize display of gathers and stacked volumes for QC purposes. Evaluate field records to validate source parameters, monitor noise and review data quality. The flexibility of INTViewer is nearly infinite.
Combine heterogeneous data in a powerful Map View
With the INTViewer Map View, integrate time slices, horizons, line locations, wells, culture data and more into a single quality display. The map view is fully GIS aware and supports more than 4000 projections. You can also enrich your maps using Bing Maps? plug-in to add street maps and satellite images, or export maps to Google Earth?.
View and Analyze Log Data
Well deviations and log curves can be visualized in Cross-section, 3D and Map views. A dedicated WellLog track display is available for advanced display of logs. Log data can also be analyzed using the interactive cross-plot, histogram and table views in INTViewer.
Document and Present your Analyses
Link pre-stack data to seismic volumes and interpretation. Layer disparate data formats, file types, and data sources with full control of layer ordering and transparency, then compare data sets using Peel and Reveal functionality or a movie mode. You can track the cursor location when navigating through the data, from window-to-window or layer-to-layer.
Capture and Share Data Analysis Sessions
Stop wasting days re-tracing your analysis steps and taking screen captures. The INTViewer SessionShot? feature shortens presentation preparation time by allowing you to capture a snapshot of your work session, complete with window layout and links to underlying data. You can restore the saved sessions at any time to rapidly review alternative data analyses for faster, fact-based decision making.
Customize INTViewer to Match Your Workflow
INTViewer is built upon the open source Netbeans Rich Client Platform, which provides a standards-based environment for creating and managing plugin functionality. Plug-ins can be distributed and updated through a web-based update center. Examples of current plug-ins include spherical divergence correction, Butterworth filter, Signal-to-Noise analysis, Navigation QC, and Binning 4D.
Share Data and Workflows with Other Systems
INTViewer provides several scientific computing interoperability plug-ins, including Matlab integration, the Seismic Workbench, and the Python plug-in.? These plug-ins enable seamless integration of third-party tools or proprietary systems for rapid algorithm development, data analysis, and numerical computation.
Supports Virtually Any ISV Platform, Data Format, File Type or OS
We designed INTViewer to facilitate your data visualization tasks anytime, anywhere. So, no matter how complex or large your data sets are, INTViewer allows you to open and view multiple windows of various data formats and file types (SEGY,SEG2, Promax, SU, SEP, JavaSeis, SEGD). This all adds up to making data review, analysis, and team collaboration much easier.
ж–Ү件еӨ§е°Ҹпјҡ1DVD

